Spotify Top 10
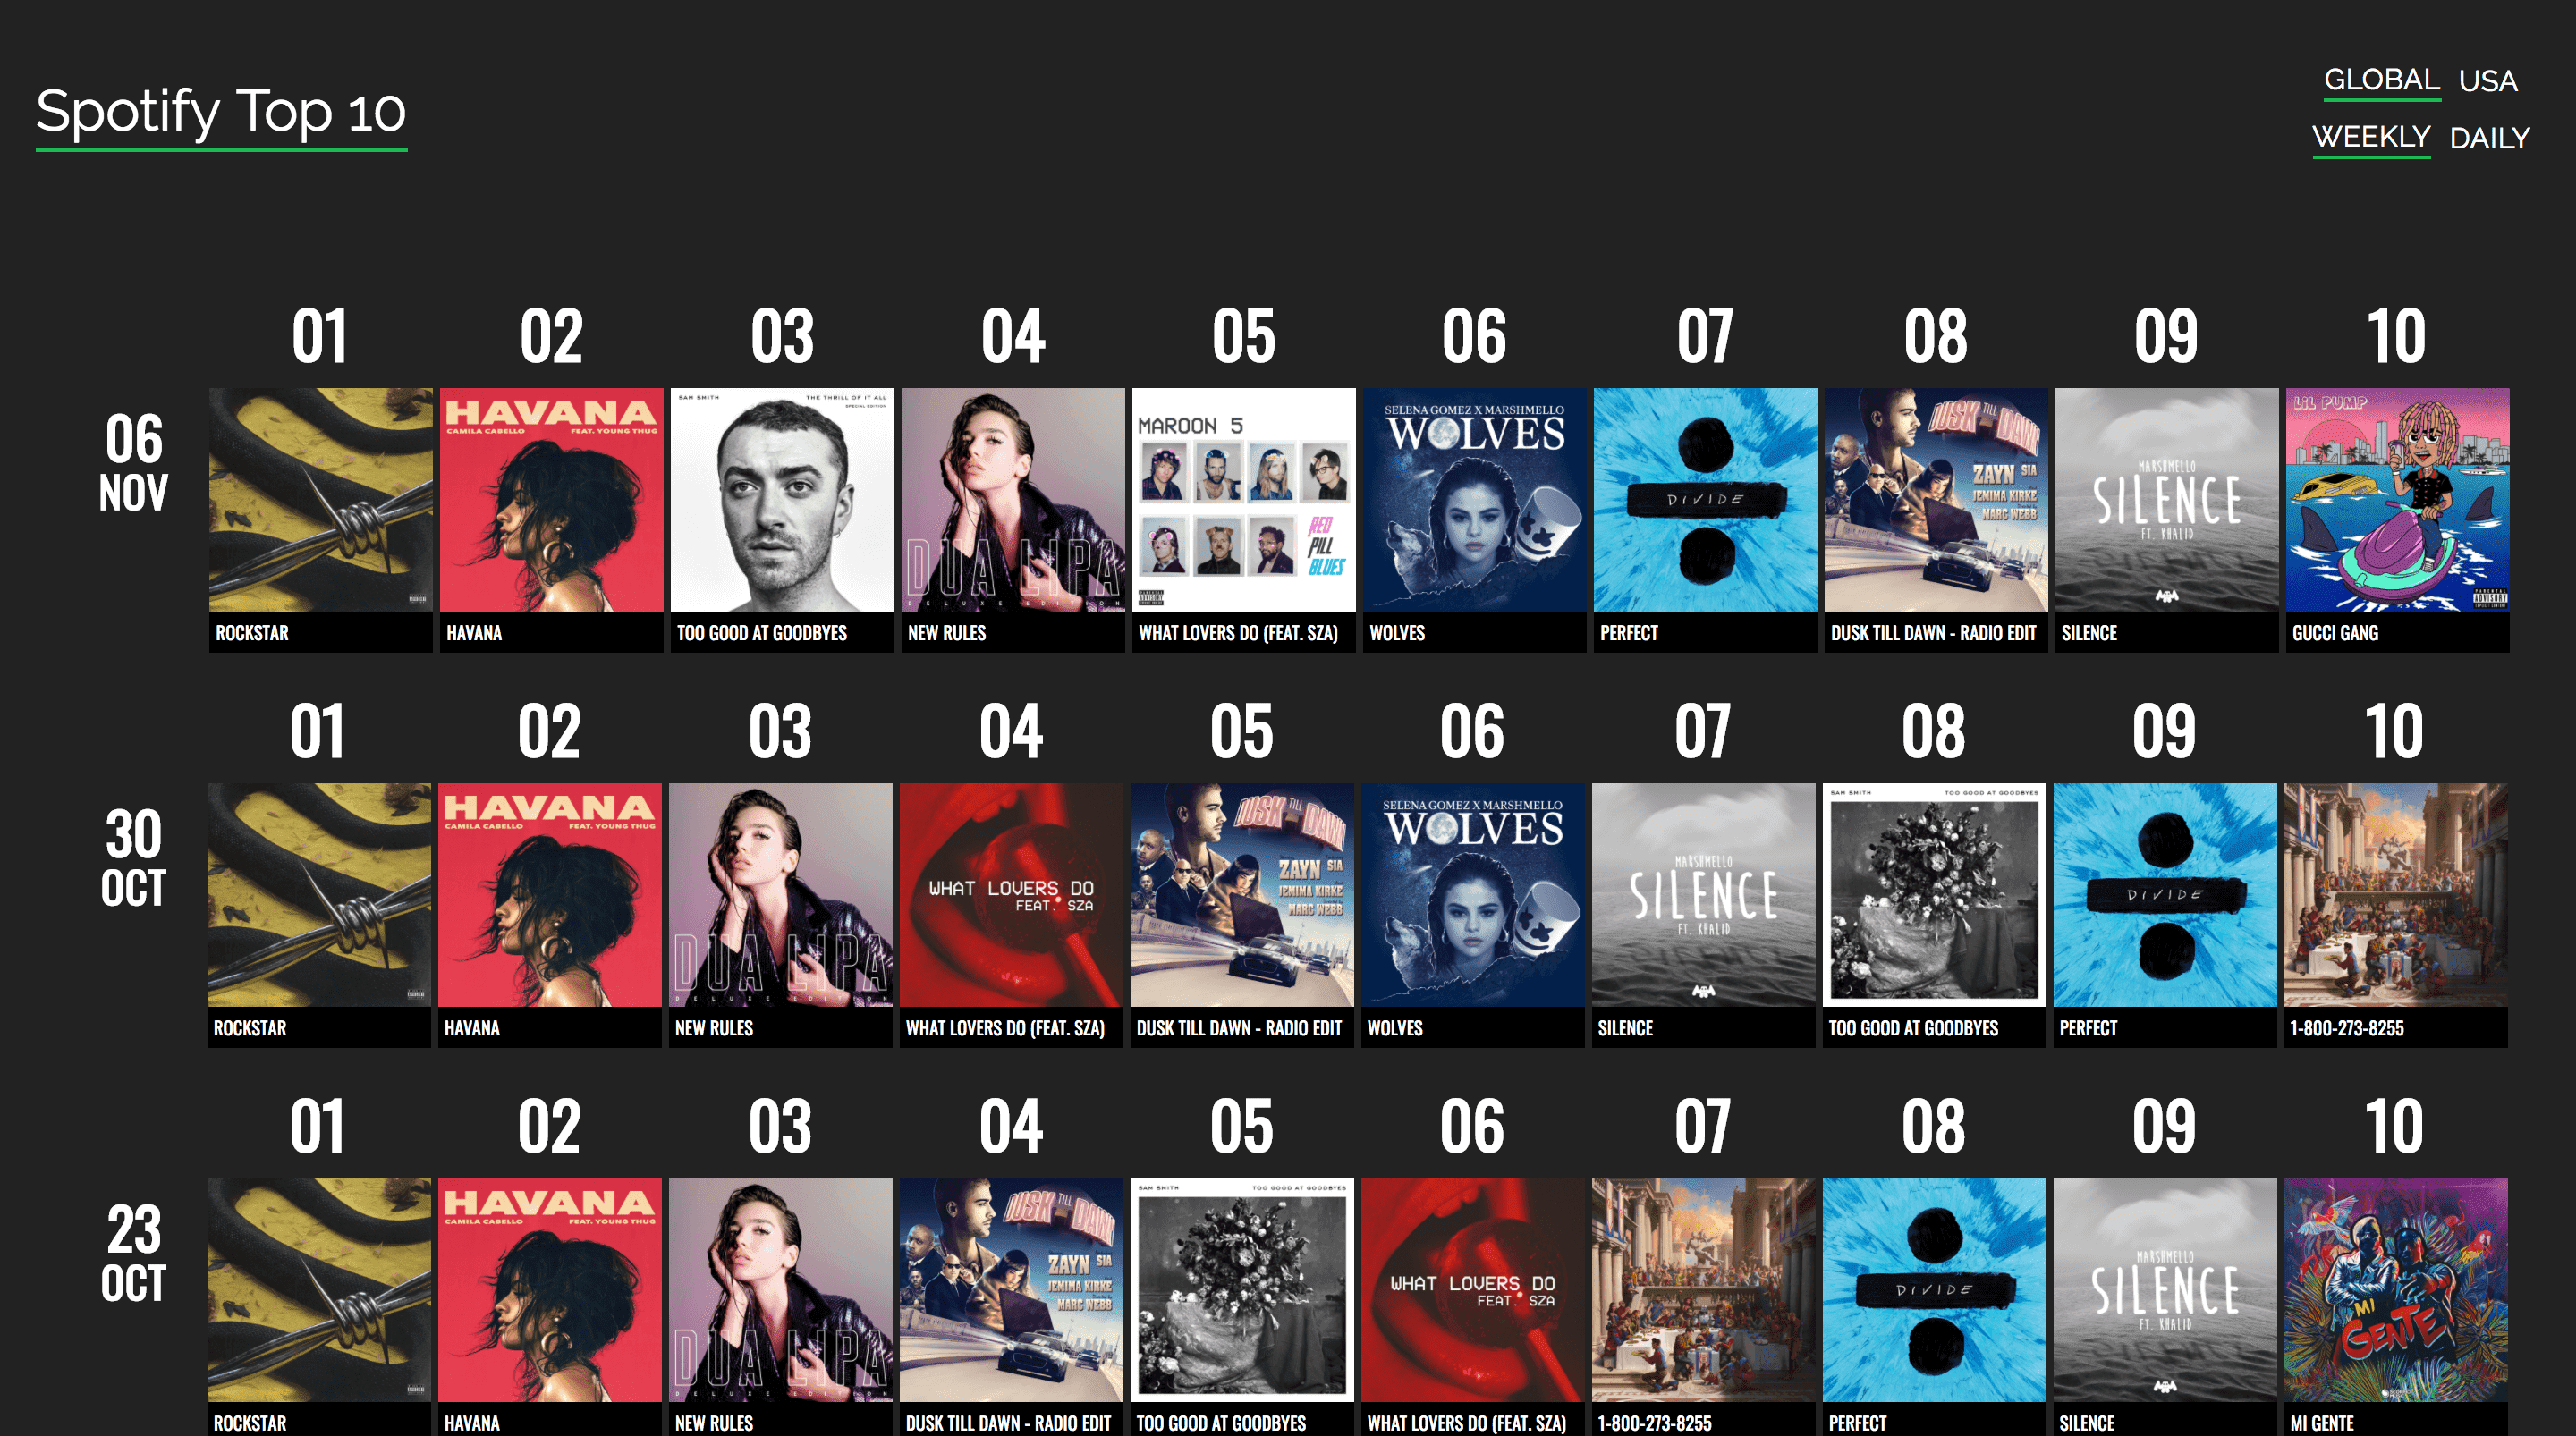 The landing page - top 10 songs of the week
Soon after finishing my summer 2017 internship, I wanted to practice my newly-learned React skills with projects using corporate data. As a Spotify Premium listener, I decided to try my hand at the Spotify API.
To gather data necessary for the visualizations, I wrote two scripts:
data_grabber.jsthis script queried the Spotify API for the top 10 tracks on the USA Top 50 and Global Top 50 charts, storing the data in json files organized by date (e.g.01\_08\_17.json).rank_collector.jsthis script parses the date files, storing the rank (1, 2, ..., 10) of a track in a given week by the unique key of the track (e.g.7wGoVu4Dady5GV0Sv4UIsx.jsonrefers to Rockstar by Post Malone).
This json data is loaded into a Redux store. Track cards are generated by mapping over this data. When a user hovers over a track card, all cards with the same aforementioned unique track key remain opaque while all other cards become almost fully transparent. This affords a user the ability to see the rank of a track over time.
![]() The tracking system, visualized
The tracking system, visualized
More information about the track, as well as another form of visualized tracking, is available when a track card is clicked.
 The data for each track